
"If you build it, he will come." In Field of Dreams, an Iowa farmer hears a voice in his cornfield and plows under his crop to build a baseball diamond on faith alone.
Courthouse planning often runs on a quieter version of that faith: they came, so the cases will come. When a county grows, it seems obvious that the courts must grow with it. But the link between how many people live in a jurisdiction and how many cases reach its courthouse is far weaker than most people assume.
We hear it at budget hearings: "The county has grown 20% since the courthouse opened, so we need a bigger one." The population sets the backdrop. Policy and practice decide how many cases actually reach the court.
The numbers don't move together
From 2012 to 2025, the U.S. population grew 9%. Over the same period, filings in state courts fell approximately 22%. Comparing filing counts from the National Center for State Courts with Census population estimates for 48 states, the trend of a growing population and shrinking caseload appears in almost every state.
Nationally
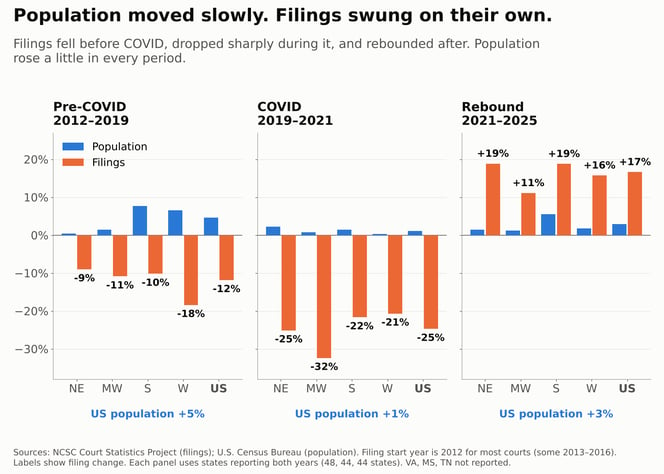
Filings didn't simply drop during COVID and bounce back. They were already falling before the pandemic: down 12% from 2012 to 2019, while population grew 5%. COVID took them down another 25% by 2021. The rebound since then has been real, with filings up 17% from 2021 to 2025, but population grew only 3% over those years. Filings rose and fell on their own schedule.
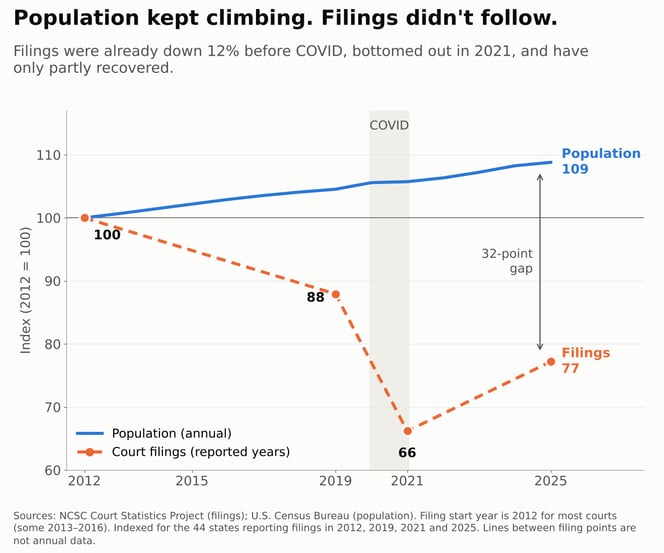 The chart above puts population and filings on the same scale by setting both to 100 in 2012. Population rose steadily and ended 9% higher in 2025. Filings were down 12% by 2019 and 34% by 2021, and in 2025 they were still 23% below their 2012 level.
By region
The chart below shows the pattern holds in every region. Over the long run, the South grew fastest, with population up 15%, and its filings still fell 16%. The Midwest grew 4% and saw filings drop 32%. The Northeast (population up 4%, filings down 19%) and the West (up 9%, down 24%) followed the same pattern.
 By state
The chart below shows the relationship between population and filings at the state level. In 41 of 48 states, population went up while filings went down. If filings tracked population, the dots would form a clear, upward diagonal line. Instead, the correlation is weak (r = 0.26).
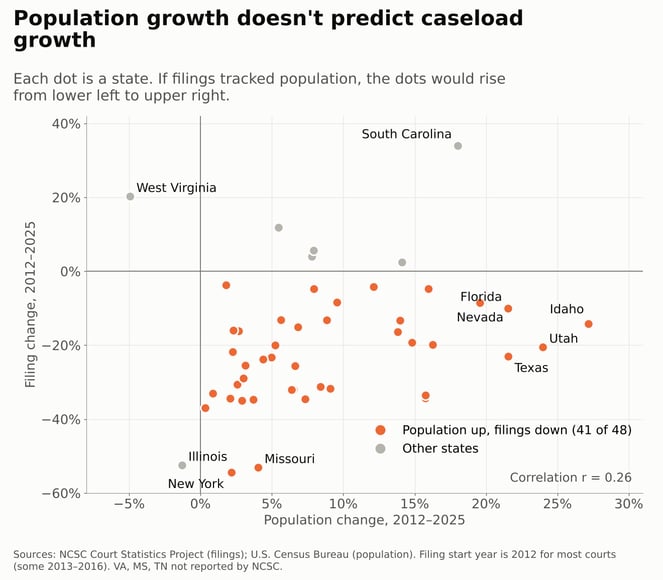
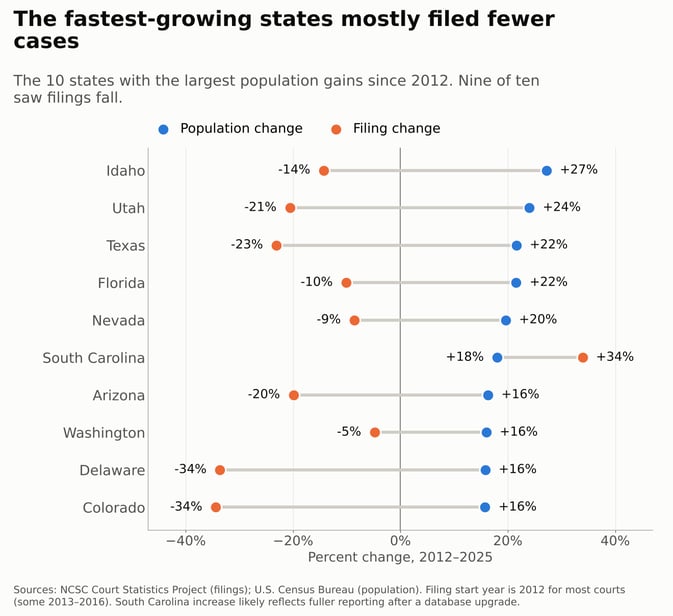
In the chart below, the fastest-growing states make the point most clearly. Idaho’s population grew 27% with 14% fewer cases filed. Utah’s population grew 24% with 21% fewer filings, and Texas grew 22% with 23% fewer filings. Of the ten fastest-growing states, nine saw filings fall. The one exception, South Carolina, most likely reflects more complete reporting, not more cases.
For more on why caseloads have declined, see our earlier post, "Court Caseloads in Decline: Challenges and Opportunities."
What moves caseload instead: policy, and the pendulum
If the population isn't steering caseload, what is? New York offers a fifty-year case study in how policy swings move filings far more than population does.
Criminal filings follow the law
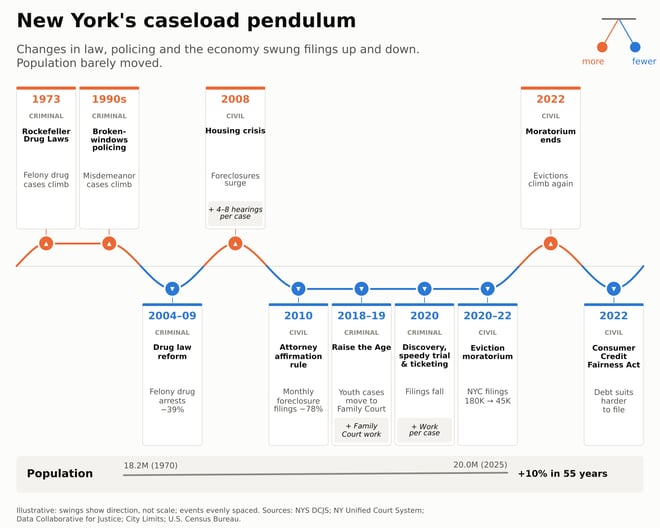
The figure above traces the laws and policies that swung New York state’s caseload up and down over five decades. The first swings were upward: the Rockefeller Drug Laws and broken-windows policing drove a surge in felony and misdemeanor filings . Drug law reform brought them back down: felony drug arrests fell 39% between 2009 and 2018. The state's population barely changed over the same period.
Then came the 2020 discovery and speedy trial reforms. Filings went down, but the work per case went up: more discovery compliance hearings, motions, and appearances before a case is resolved. A courthouse sized to 2019 filings would have misread both the volume and the workload.
Some swings move cases instead of removing them
Raise the Age shifted most 16- and 17-year-olds from criminal court to Family Court. The total barely changed, but the cases now needed different courtrooms, waiting areas and staff . The 2020 reforms also steered police away from custodial arrests and toward desk appearance tickets for most low-level offenses. That changes when and how people arrive at the courthouse, and how many overnight arraignments the building has to support. A plan built on total filings alone would have missed both shifts: more Family Court cases and fewer overnight arraignments .
Civil filings follow the economy and the filing rules
Foreclosures surged after 2008, and new laws added mandatory settlement conferences, often four to eight court appearances per case, that further strained court resources. A later rule brought relief by requiring attorneys to verify their paperwork, and monthly foreclosure filings fell 78%. The COVID eviction moratorium and the Consumer Credit Fairness Act swung housing and debt dockets the same way. A plan that assumed caseloads would follow population trends would have missed every one of these turns.
Who lives in a county matters too. Will look at demographics in a follow-up post.
Why this matters for the building
A courthouse is built to last 50 years or more. Over that time, filings will rise and fall many times for reasons that have little to do with population. Sizing a building to the population curve risks building for cases that never arrive.
The opposite risk is just as real. Fewer filings do not always mean less need for space. Cases that take more hearings to resolve keep courtrooms busy even as the count falls. Pro se litigants (self-represented) need help centers and space to wait. Treatment courts need room for teams and service providers. Family Court may need more space while criminal court needs less.
Jury trials show why the mix matters. Nationally, jury trials resolve fewer than 1% of civil cases and 1-3% of criminal cases in state courts , and the rate has kept falling over the past decade. Jury courtrooms are the largest rooms in a courthouse and bring jury assembly, deliberation and holding space with them. The number of jury trials a court plans for shapes the building more than almost any other decision.
The question is not only how much space a court needs, but what kind and where.
What to ask for instead
Population still belongs in the analysis. It just can't carry the analysis alone. Before sizing a new courthouse or an addition, ask for three things:
- Caseload history by case type, not a single total. A flat total can hide criminal filings falling while family or civil filings rise, and each needs different space.
- A timeline of law and policy changes over the same period. Breaks in the trend usually line up with a new law, a court rule or a change in enforcement. Knowing which helps separate one-time shifts from lasting ones.
- Projections as scenarios, with the assumptions stated. Population should be one input among several. Filing counts, courtroom activity, utilization and occupancy rates, and jury trial activity show how the existing building is actually used. A range of outcomes built on those measures holds up better than a single number when policy changes again.
Building on evidence, not faith
Population is where a caseload analysis starts, not where it ends. The farmer in Field of Dreams built on faith and the players came. Courthouses are too costly and too long-lived to build that way. The better question for a growing county is not "how many people are coming?" but "which cases will they bring, and what will those cases need from the building?"
In a future post, I will look at how the age mix and household makeup of a growing population shape the cases a court sees.
Get your copy of the Fundamentals of Courthouse Design